Kitchen OS · The Home Demand Signal
The kitchen is the last
unmeasured demand signal.
Trepo turns real household consumption into a live, SKU-level demand signal — so the brands people actually buy finally see what happens after the sale, inside the home.
Trepo Signal — Partner Overview
What We're Solving
The sale is measured.
Then the kitchen goes dark.
Measurement stops at the checkout line. Scan data says a unit left a shelf — weeks later, aggregated, household stripped out. But the next purchase isn't decided at the shelf. It's decided at home, in the five things nobody currently sees together.
🧊Composition
What's actually in the home — the whole pantry, standing, not just your SKU.
🧭Context
What sits next to it. The competitive set and the full basket — across every retailer, not one banner.
🍳Use
What it gets used in. Recipes, dishes, occasions — the job the product is actually doing.
📝Intent
What they plan to buy next. Lists and saved recipes — captured before the purchase.
🔁Consumption
What gets used up, and how fast. The re-buy rhythm that times the next order.
Any one of these is a data point. All five, on the same household, over time — that's our demand signal. Trepo is the only place they're captured together.
01 · What We're Solving
The Hardware
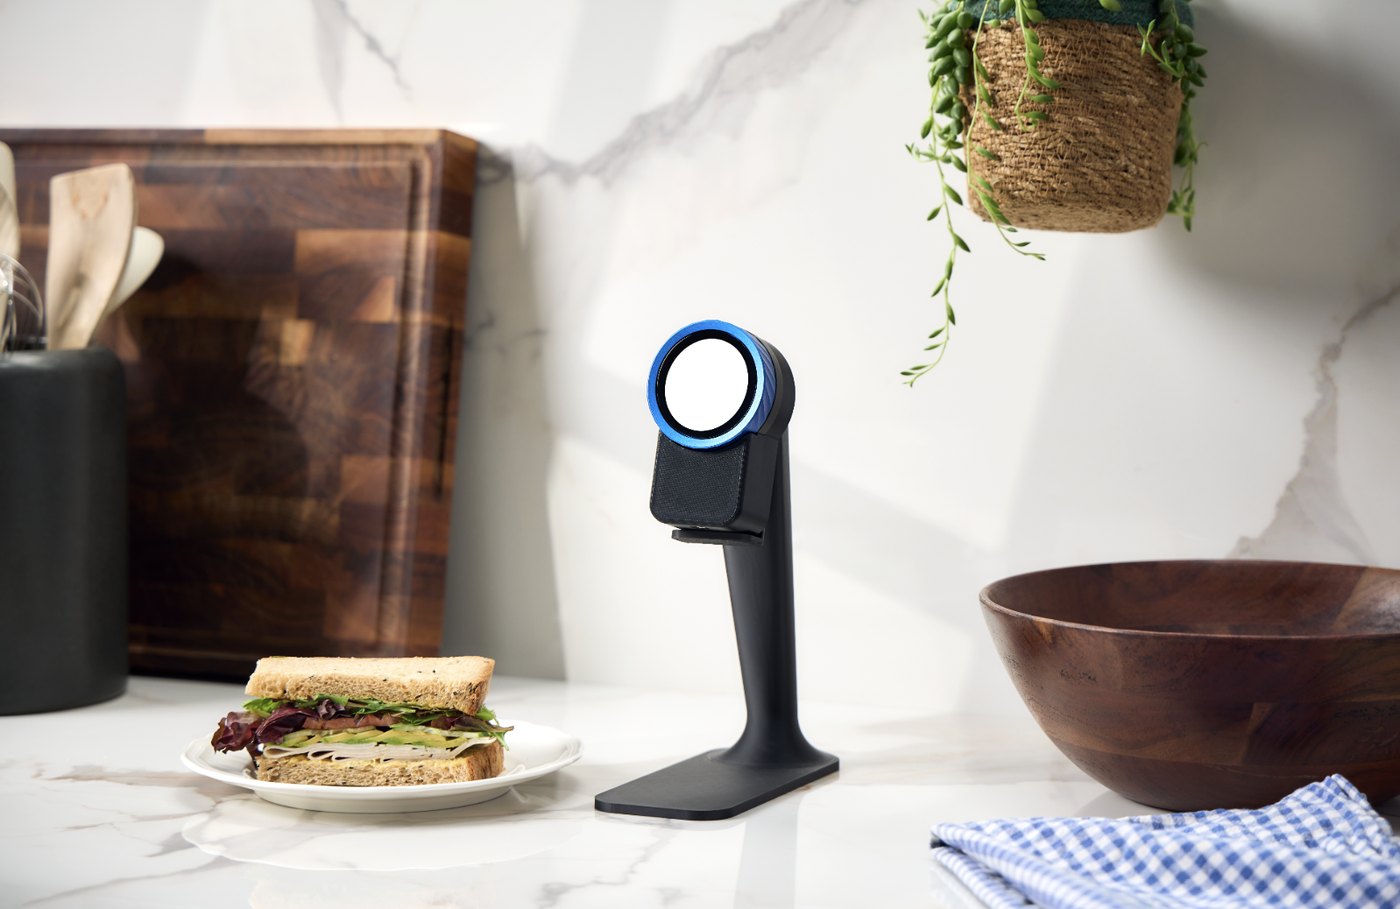
Trepo Halo: the assistant
that lives in the kitchen.
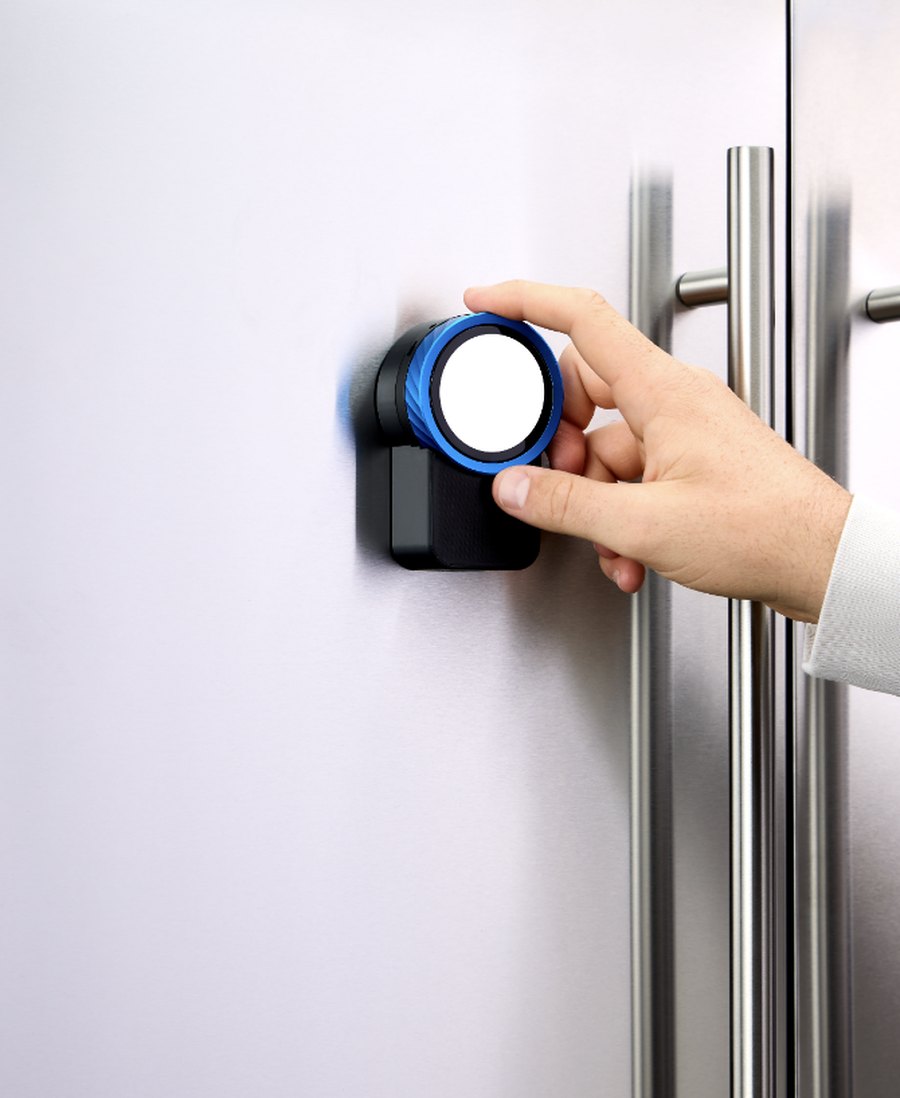
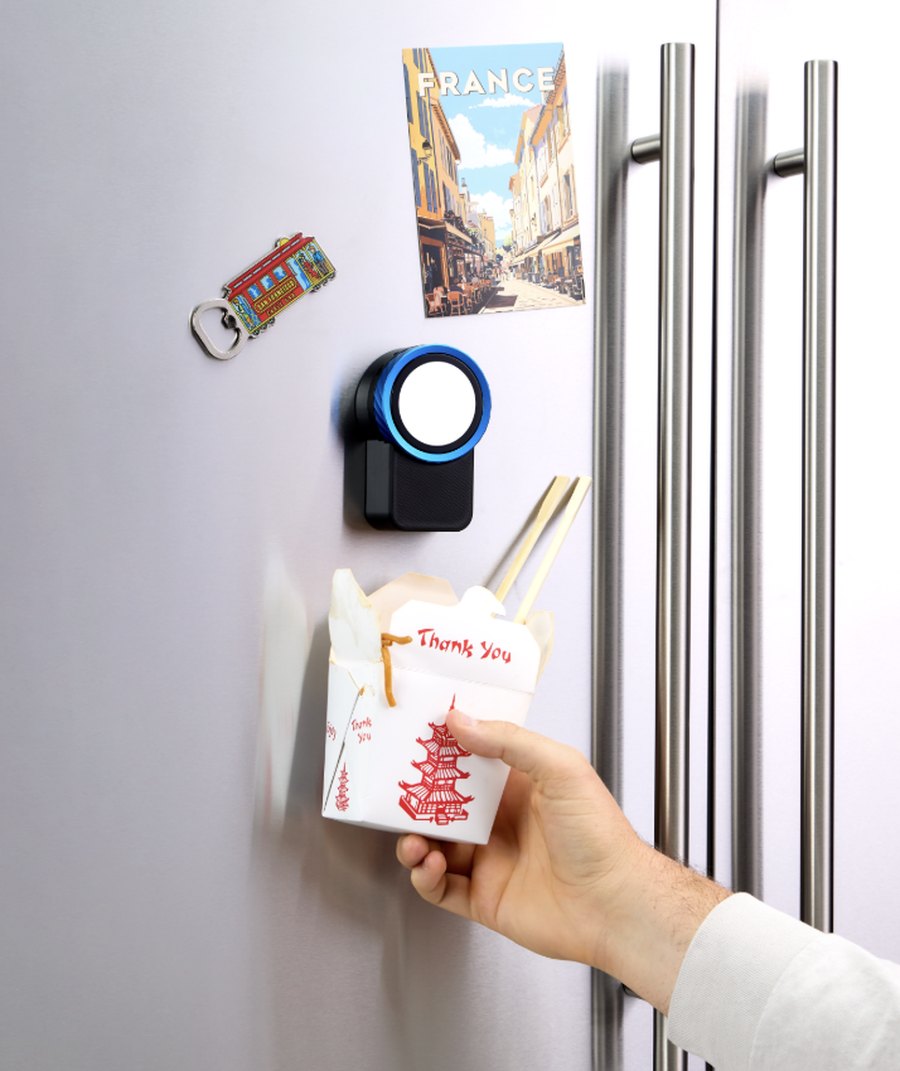
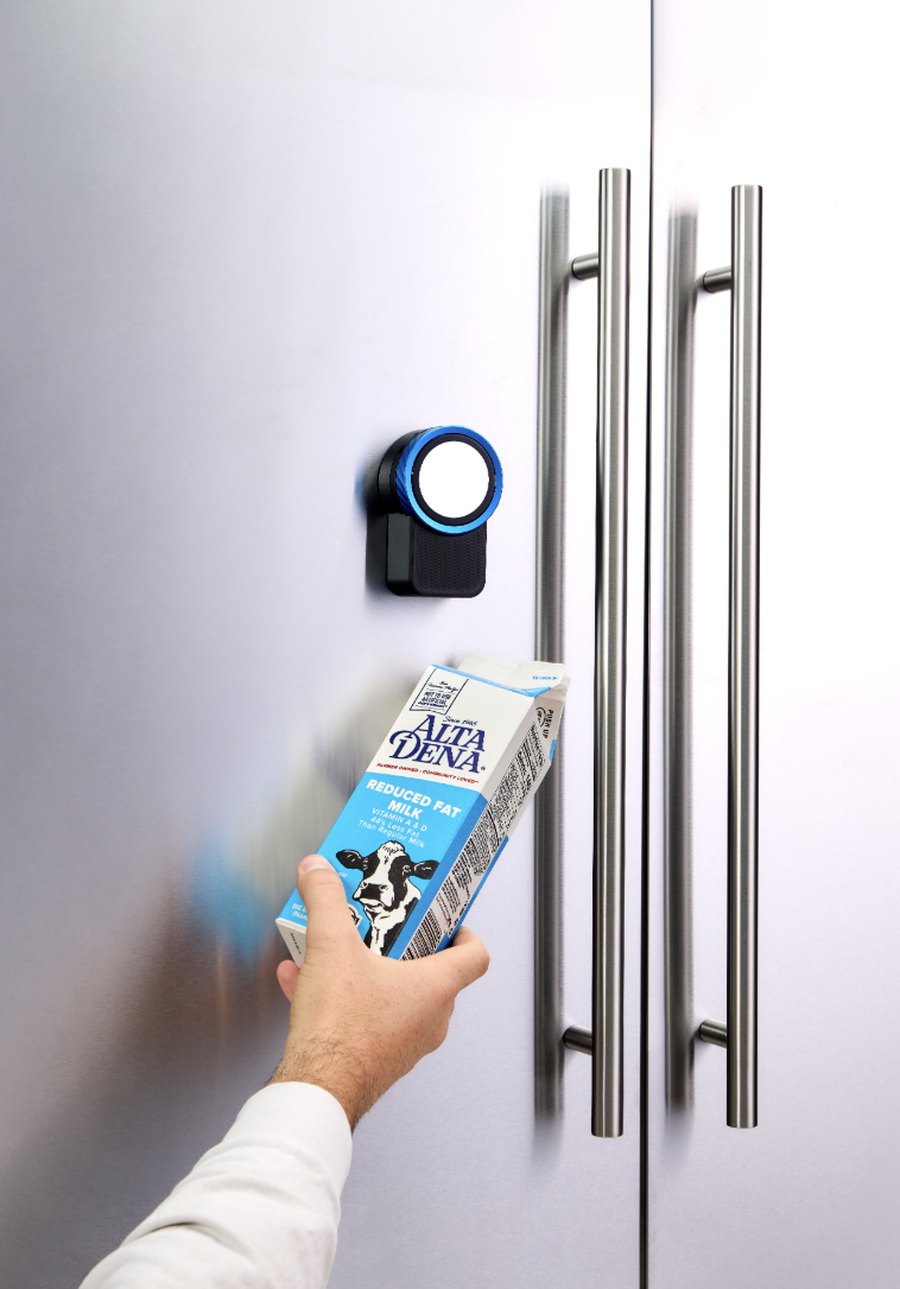
Measurement has to live where the food does, or it doesn't happen at all. Halo magnetically mounts to the fridge door or the counter and stays there — so logging the groceries, the leftovers, and the carton you just emptied takes a second, in the moment, as part of cooking. No app to open. No list to keep. No pen and paper, and nothing to remember later. It's the only capture method that survives a real week in a real kitchen — and it runs the full loop, from what came in to what needs reordering.
Lives in the kitchenMagnetically mounts to the fridge or sits on the counter — in the traffic pattern of the room, never in a drawer.
Groceries, on the way inLog the haul while you're unpacking it. It's in the kitchen before the bags are empty.
Leftovers, on the way outThe half-used and the left-over — what's actually still in the fridge, and when it really gets eaten.
Running low, straight to the listDown to the last of it — one scan puts it on the list, and eventually reorders it.
02 · The Hardware
The App
Four everyday habits —
four layers of behavior.
Checking in what you bought. Seeing what's on hand. Saving a recipe you want to make. Building the list for the next trip. Households do these for their own reasons — and each one reveals a different layer of how they buy, cook, and run out. That's the flywheel: the signal exists because the product is genuinely useful to them.
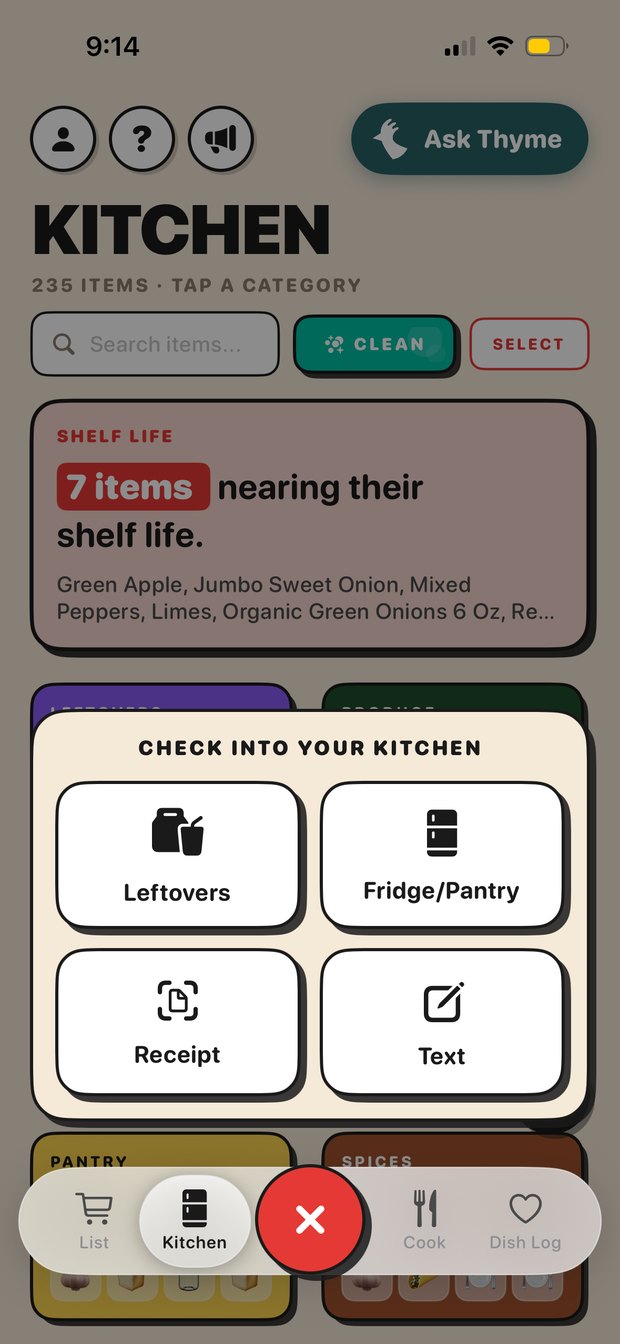
Check In
Four ways into the kitchen — leftovers, fridge/pantry scan, a photographed receipt, or plain text.
SignalMulti-modal capture — full-basket receipts alongside item-level scans.
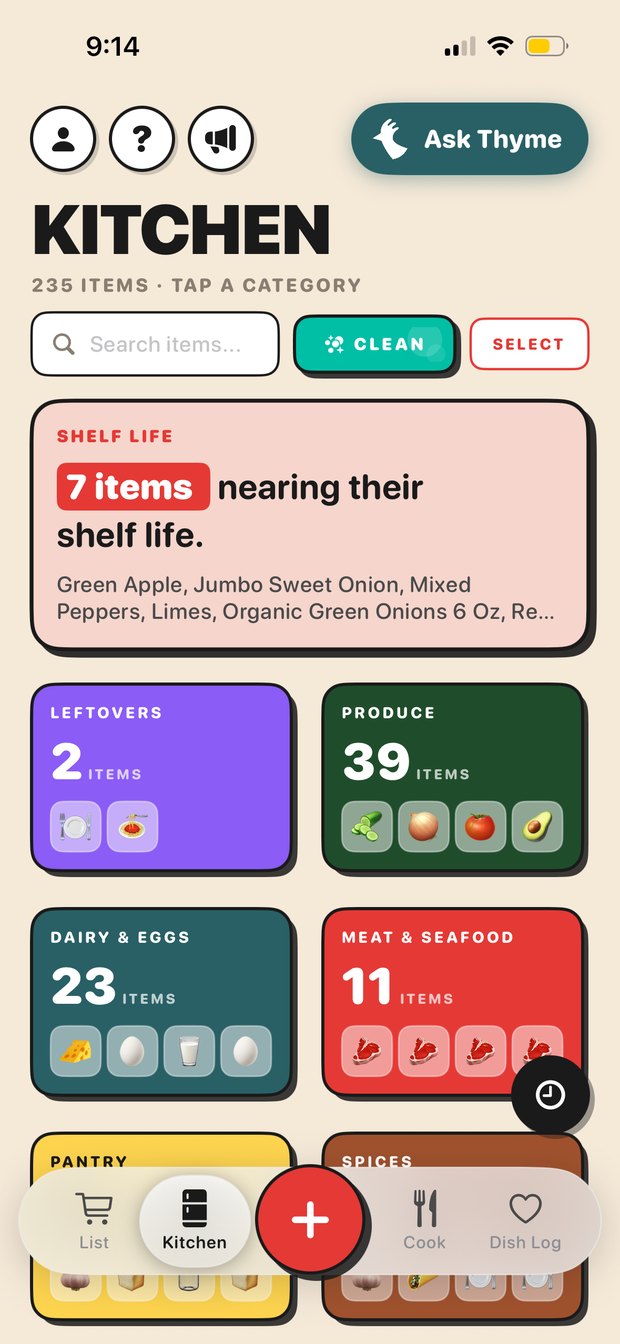
The Kitchen
A live inventory by category — here 235 items — with shelf life flagged before anything is wasted.
SignalComposition — the standing pantry, SKU-resolved, not just your shelf.
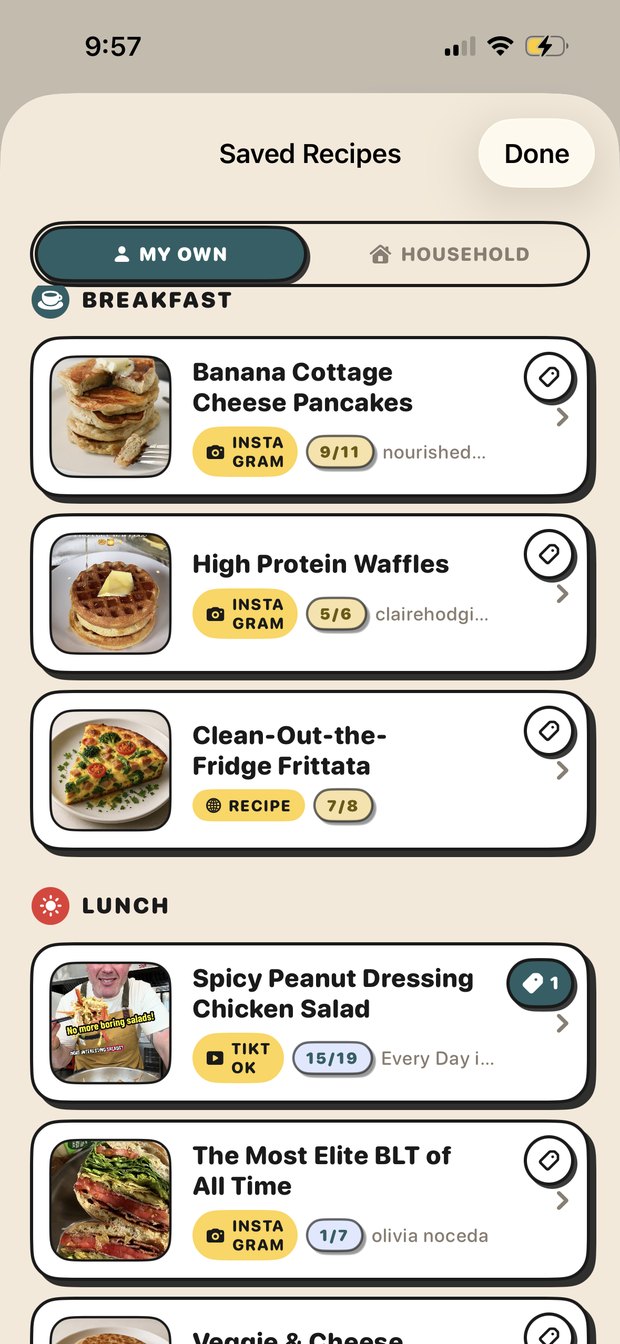
Recipes & Cook
Save a recipe from Instagram or TikTok. Trepo scores it against the kitchen — 9 of 11 ingredients already on hand.
SignalUse & intent — the dish the product is bought for, and the gap it has to fill.
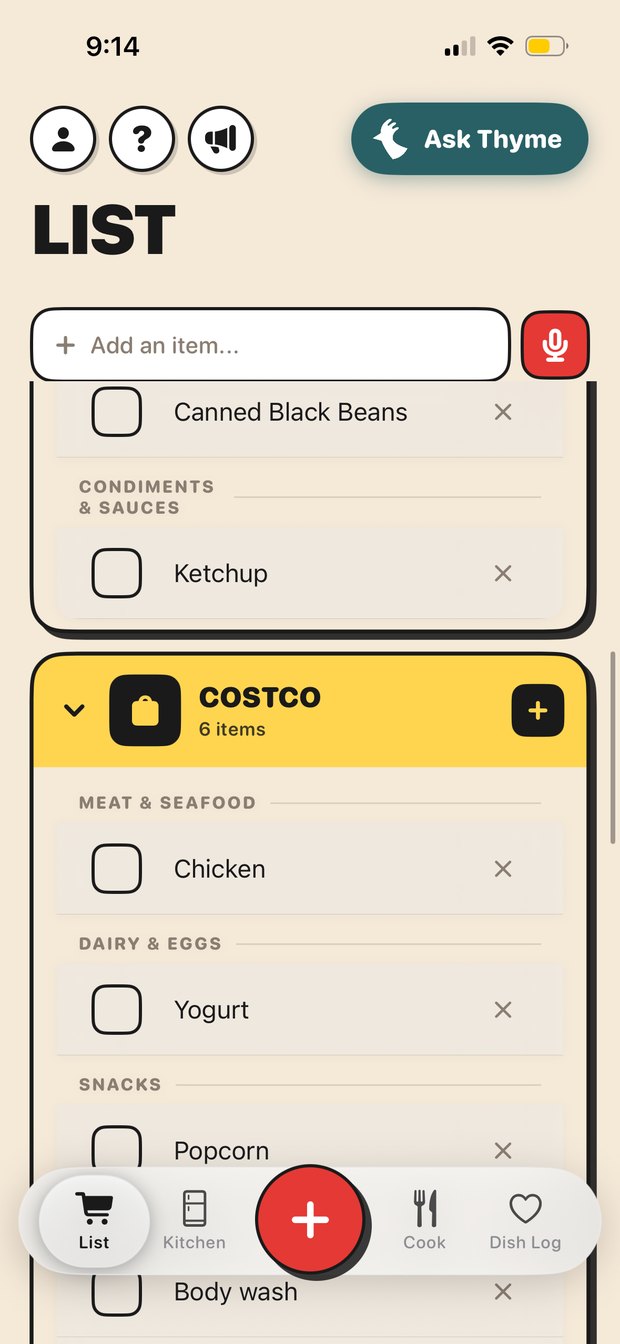
The List
Auto-built, split by store, and voice-addable. What the household intends to buy, before they buy it.
SignalIntent, pre-purchase — named-brand grain, attributed to a retailer.
03 · The App
The Loop
How the signal
is generated
1 · CaptureA vision-based system reads what's in the kitchen — items, receipts, leftovers — through the Trepo device and app.
→
2 · Kitchen GraphCaptures resolve to real SKUs and build a live inventory + consumption history per household.
→
3 · Consumer ValueThey get auto shopping lists, run-out alerts, and less waste — the reason they keep logging.
→
4 · Trepo SignalAggregated consumption becomes a live demand signal for brand partners.
The magic: consumers log for their own benefit. That self-interest is what keeps the signal continuous and honest — not a survey they'll abandon.
04 · How It Works
The Asset
No one has ever measured
the kitchen. We do.
Every other data source stops at the register. Retail data shows that a product was bought. Consumer panels ask people to remember, weeks later, what they ate. Store loyalty programs only see what was bought at that one chain. Not one of them can tell you what is actually in the home, or what happens to it there.
SKU
Down to the individual UPC — not a category estimate
Live
A continuous stream, not a quarterly snapshot — 4,900+ users active in the last 7 days
In-home
Measured after the sale, where every other source goes dark
All of it on the same household, at once. That's the Kitchen Graph.
95,000+
Distinct SKUs captured
540,000+
Item logs to date
05 · The Kitchen Graph
What Trepo delivers
to your brand
👥Household panel & profiling
Understand who consumes your category — and your SKUs vs. competitors' — by inferred demographic and real basket, from consumption alone.
📈Replenishment timing
Observed in-home dwell time and repeat-log cadence, by category and household — a read on reorder demand that starts where scan data stops.
💡New-need detection
Spot emerging occasions, seasonal spikes, and unmet needs as they form in the home.
🔬Product & concept testing
Run permissioned panels against real households — reactions grounded in their actual pantry.
🎯Targeted sampling & offers
Reach households by real consumption behavior — lapsed buyers, category-adjacent, high-frequency.
🛍️Intent, before the trip
Lists and saved recipes are captured pre-purchase — and we can already match them to the receipts that follow, across retailers.
06 · What Brands Get
Trepo Signal · Sample Households
Six households,
six demand profiles
Anonymous Household One
Affluent coastal wellness home
InferredF · 35–45 · family lead
BasketCostco / Trader Joe's, organic-everything
Region readUpscale SoCal coast ✓
High share-of-wallet, brand-loyal, wellness-forward household purchasing lead.
Anonymous Household Two
Young convenience-forward single
InferredM · 26–34 · 1–2 person
BasketSnack + convenience, heavy scans
Region readSoCal beach city ✓
Scan power-user — richest SKU-level signal. Ideal UPC-tracking panelist.
Anonymous Household Three
Sun Belt value home cook
InferredF · 55–70 · cooks for a group
BasketComfort staples, recipes, cookout qty
Region readFL retirement community ✓
Planning-driven, whole-household basket incl. non-food. Seasonal spikes visible.
Anonymous Household Four
Value-meets-wellness suburban family
InferredF · 30–40 · family of 3–4
BasketDiscount + club + grocer, plant-forward organic
Region readAffluent Southeast suburb ✓
Premium-organic on a value budget, recipe-led. Biggest basket in the set.
Anonymous Household Five
Warehouse-club family, leftover tracker
InferredF · 30–45 · family with kids
BasketBulk club + diverse pantry, wellness tilt
Region readNortheast / Mid-Atlantic ≈
Best leftover/consumption logger in the set. (≈ region inferred — no ZIP on file.)
Anonymous Household Six
Midwest urban scratch cook
InferredF · 28–40 · 1–2 person
BasketTrader Joe's / Aldi / Meijer, global pantry + protein
Region readChicago urban core ✓
Deepest from-scratch pantry in the set — miso, furikake, matcha, five baking staples. Halo device household.
All profiles are anonymized and aggregated. Trepo shares behavioral signal, never personal identity — names, contact details and precise location are never exposed. ✓ = region confirmed by ZIP on file; ≈ = behavioral inference only.
07 · Sample Households
Trepo Signal · Activatable Audiences
Behavioral audiences,
read from the pantry — not guessed.
Nobody was asked what kind of shopper they are. Each household earned its group by what it actually put in the kitchen — real, addressable people, not a survey segment or a modeled lookalike. Shares are of the 4,516-household active panel.
Health-conscious / organic63%
High-protein / fitness58%
Plant-based / dairy-alt23%
Conquest switchersTarget households loyal to a competitor brand in your category.
Replenishment windowReach a home on its own re-buy cadence — as it's due to run out.
Category winbackFind households that quietly lapsed out of your category.
Precision samplingPut product in the exact pantry profile you want — nothing wasted.
Audience membership is derived from real logged pantry contents; shares are of the 4,516-household active logging panel, as of Aug 2026, and shift as the panel grows. Behavioral signal only — no personal identity is exposed. Brand-loyalist and switcher audiences resolve to named brands (e.g. private-label, Heinz, Barilla, Chobani); replenishment timing is derived from repeat-log cadence.
08 · Activatable Audiences
Trepo Signal · Brand Affinity
Click into a brand's kitchen —
see the pattern.
The layer underneath the audiences: pick any brand and see what else its households over-index on versus the base — the shopper persona around your brand, observed, not modeled. Three live reads:
Households carrying Barilla · 689 homes
The center-store meal builder
Minute rice2.9× over-index
Idahoan2.8×
Lipton2.7×
Campbell's2.5×
Del Monte2.4×
A third of Barilla homes also carry Campbell's. These are shelf-stable meal-assembly kitchens — rice, potatoes, soup, canned veg — not a fresh-first basket.
Households carrying Heinz · 869 homes
The condiment wall
French's2.4× over-index
Ken's2.4×
A.1.2.2×
Hellmann's2.0×
Huy Fong2.0×
One in five Heinz homes carries Hellmann's, French's and sriracha. Heinz doesn't sit alone — it anchors a whole condiment shelf, and hot sauce sits right next to the ketchup.
Households carrying Chobani · 664 homes
The everyday protein basket
Sargento1.8× over-index
Fairlife1.7×
Simple Truth Organic1.7×
Kodiak1.6×
Starbucks1.6×
Protein-forward but mainstream — high-protein milk, cheese, protein pancake mix, organic private label. Lifts run lower here because Chobani is in one in six kitchens: a broad brand's cohort looks more like everyone.
Audiences tell you how many kitchens carry you. This tells you who your buyer actually is.
Over-index = a household carrying the anchor brand is that many times more likely to also carry the paired brand than a household drawn at random from the panel. Computed from 4,133 real logged pantries (Aug 2026), requiring at least 40 households behind every pair shown — the pairings above sit on 40–228 households each. Lift compresses toward 1.0 for anchor brands with very broad penetration, so magnitudes are only comparable within a card, not across them. Behavioral signal only — no personal identity exposed.
09 · Brand Affinity
Trepo Signal · The Consumption Clock
How long your category
actually lasts in the home.
Scan data tells you the day a product was bought. It cannot tell you the day it ran out — and the day it runs out is the day the next purchase gets decided. Every bar below is measured: a real household logged the item in, then logged it gone. Median days in home, by category.
Pantry & dry goods7.6 days
15,583 measured spansItem-in to item-gone, across 1,407 households — observed, not surveyed or modeled.
47% have logged a run-outNearly half the panel has explicitly marked something used up — up from 32% in July.
99% show re-buy cadenceVirtually every household re-logs the same product over time — the rhythm that times the next order.
This is the targeting windowReach a home in its own last-few-days window, per category — not on a flat calendar.
Measured as the observed in-home span between a household logging an item in and logging it gone — a behavioral read, not a spoilage or nutrition claim. Medians across the categories with the deepest coverage (335–920 households each); panel-wide median is 8.2 days. Aug 2026. Behavioral signal only — no personal identity is exposed.
10 · The Consumption Clock
Trepo Signal · Intent → Purchase
We watch the list become
a receipt.
A household lists an item. Days later it uploads a receipt and the item is on it — same home, same product, both ends timestamped. Panels see the purchase. Ad platforms see the intent. Nobody else sees one household do both.
861
Matched list → receipt journeys
256
Households showing the full journey
1.2 days
Median from adding it to buying it
And it crosses the banner — one panel spans every retailer, which a single chain's loyalty program structurally cannot do:
Conversion, not correlationAn item-level link between what a home said it wanted and what it actually bought.
A measurable windowThe median list-to-till gap is ~1 day — the interval a brand has to influence the choice.
The loop closes hereIntent, purchase and consumption on one household — 14 retailers, one panel, observed end to end.
Journeys are product-matched between a household's own list additions and its own uploaded receipts, founder accounts excluded; the high-confidence tier requires a specific shared product noun, and a manual audit trims it a further ~8%. Retailer is inferred from private-label brands on the receipt, so it resolves for 201 of 1,244 total matches and under-counts banners without private label. Aug 2026.
11 · Intent → Purchase
Partner With Us
The kitchen is finally
measurable.
A device that lives where the food is. An app households actually use. Real pantries, real baskets, real behavior — on the same home, over time.
Everything in this deck came out of that. The households, the audiences, the brand patterns, the shelf-life clocks, the list-to-receipt journeys — all of it read from what people logged, none of it modeled or bought.
Bring us your category and we'll show you your buyer's kitchen. Early partners help shape what the panel measures next — and see their category first.
Thank you